
December 8, 2022
Imagine a scenario where you and your team work on tickets all day, resolving issues/bugs that have arisen in your infrastructure or your source code. These issues are highlighted by an automated nightly scan spilling out a dreaded spreadsheet every morning, highlighting all the problems detected. To control the chaos, your team has cleverly decided to track these in a shared spreadsheet called the Master Tracker.
Problem: Master Tracker Has Custom Information
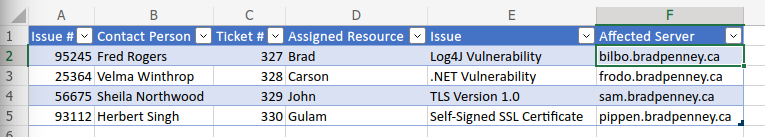
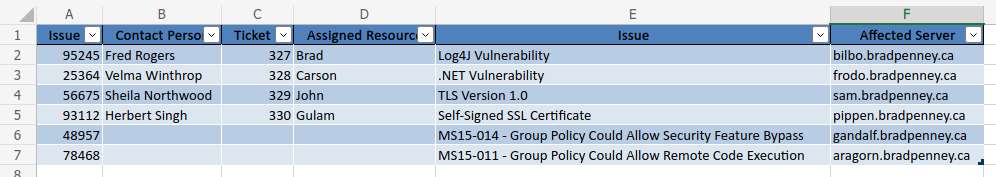
Your team has added columns to the auto-generated spreadsheet to track issues more efficiently. Adding information such as who is working on each ticket, whether other teams/resources are involved, and, of course, a ticket number from the change management system. The Master Tracker now looks like this:
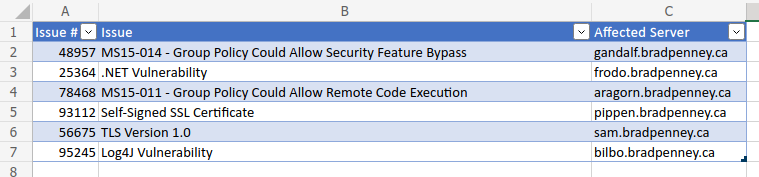
Unfortunately, the spreadsheet you receive every morning includes all the issues the team is working on. Still, it is missing the columns that the team has added for tracking purposes:
In the tiny (optimistic!) example above, there are only two new issues, which is no biggie for copy/paste aficionados. Sadly, this optimism might be far-fetched, as some mornings, the team wakes up to 50 new issues! This, combined with the fact that the Master Tracker could have anywhere between 2 and 200 matters at the end of the previous day, means that comparing these worksheets, determining new issues and merging these via copy/paste would be extremely tedious. The goal is to integrate the latest issues reported into the existing Master Tracker without losing any data the team added.
Solution: Python Pandas Merge()
Python Pandas has a very workable solution for this problem. In a nutshell, both worksheets are imported as separate Pandas DataFrames; then, we perform a merge that combines the two DataFrames without losing any data. Those rows with the same info will not be overwritten, and new rows will receive an NaN in the missing columns (which translates into a blank cell once converted back to a spreadsheet).
I’ll use a Jupyter Notebook to demonstrate this procedure, but of course, it could just as easily be done with a pure text script. The advantage of the Jupyter Notebook is that it has built-in breakpoints, so we can confirm each step is executed successfully before running the next.
Getting Started
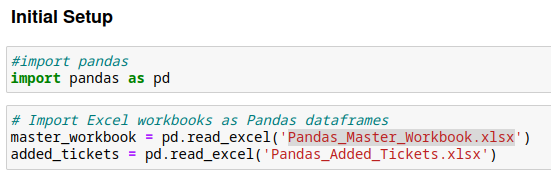
To start with, we need to import pandas as well as import each spreadsheet as a Pandas DataFrame:
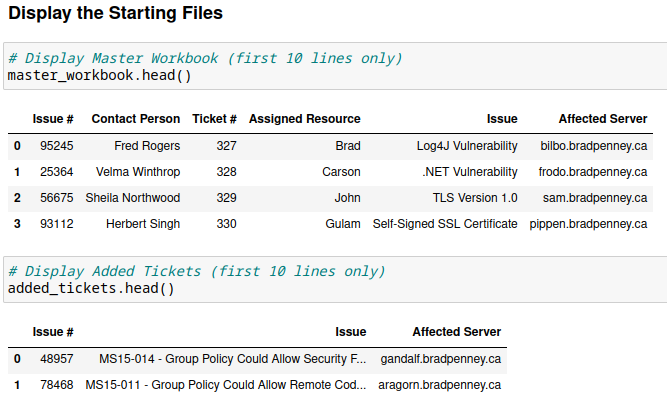
Next, we’ll display the starting files to confirm that the DataFrames loaded as expected. Note the use of the .head() method to only show the first 10 rows (in case either DataFrame is excessively long).
Determine Expected Results
To ensure we don’t have some very strange results, lets do a quick check to see how many additional rows will be added/removed from the tracker.
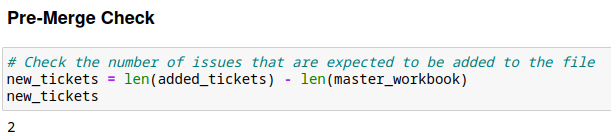
Side Note: The expectation here is that this will be a positive number. As issues are resolved, they’re removed from the Master Tracker. If the number is negative, then some issues were unexpected cleared up (wahoo!) but that will still require manually finding and removing them, at least while using
mergewithouter join.
The Magic of Pandas merge
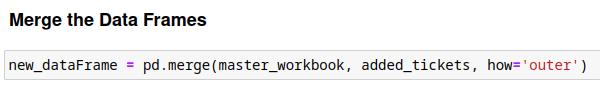
It is time to bring the magic of Pandas merge(). We will merge the two DataFrames with an outer join, which will preserve all information from both DataFrames. The command is simple – but note that the best practice is to create a third Data Frame for the results. This means we still have our two original Data Frames in case there is some problem. This depends on data size and system resources.
A quick note about joins – Pandas supports the standard joins familiar to those who use SQL in relational databases. The positioning of the arguments in the function call determines the left and right positions, so pay attention to which DataFrame is on the right and which is on the left (if using those types of joins). We want to keep everything in our case, so an outer join makes the most sense. Here’s a standard representation of how joins work in Pandas (and SQL):

The Python Pandas statement to join the two DataFrames is more simple than SQL, with the how keyword argument doing all the heavy lifting:
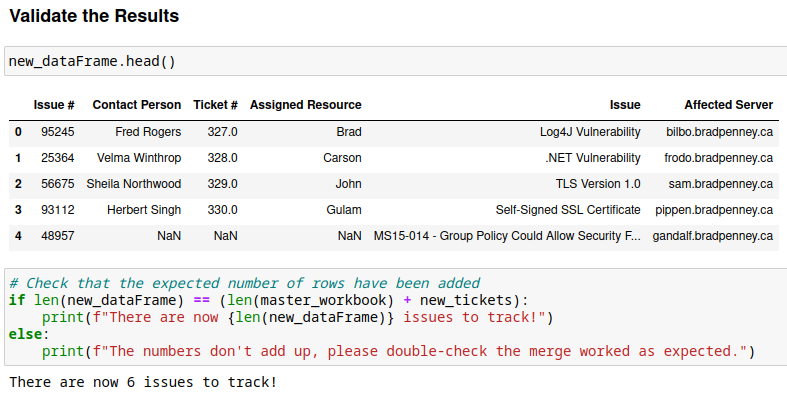
Validate the Results
Once the merge command returns without error; it is time to check the results. A quick head() method shows the new DataFrame, and then a simple if/else logic check ensures the arithmetic works out as expected:
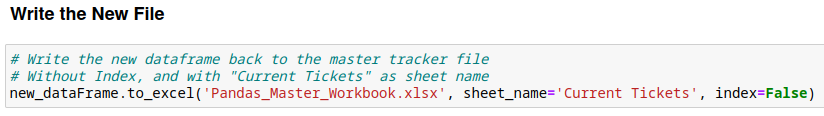
Write the DataFrame to the Spreadsheet
Once we’ve gone through the results and are satisfied that no catastrophe has befallen our Master Tracker data, we’re ready to write back to the file:
After a tiny bit of formatting inside the spreadsheet program, it is clear that the additional tickets are now included in the Master Tracker, waiting for team-generated values to be added:
In Conclusion
This brief article barely scratches the surface of how Python Pandas can help automate tedious day-to-day nuisance chores. It is also one of the most critical tools for a Data Scientist to use and be comfortable with. Feel free to consult Pandas for tons more information; I highly encourage you to dive deep and add Python Pandas to your tool belt!